Mastering SMA: The Simple Moving Average for Smarter Trading
Unlock the power of SMA in your trading strategy. Whether you're a beginner or an experienced trader, this guide explains how the Simple Moving Average can be used to refine your trading approach and even automate your strategies in algorithmic trading.
The Simple Moving Average (SMA) is one of the most powerful yet simple tools in technical analysis. Whether you're trading manually or using algorithms, the SMA can help you identify trends, confirm support/resistance levels, and automate your strategies. In this guide, we'll walk you through the basics of SMA, its calculation, and how to use it effectively in your trading strategies.
What is SMA?
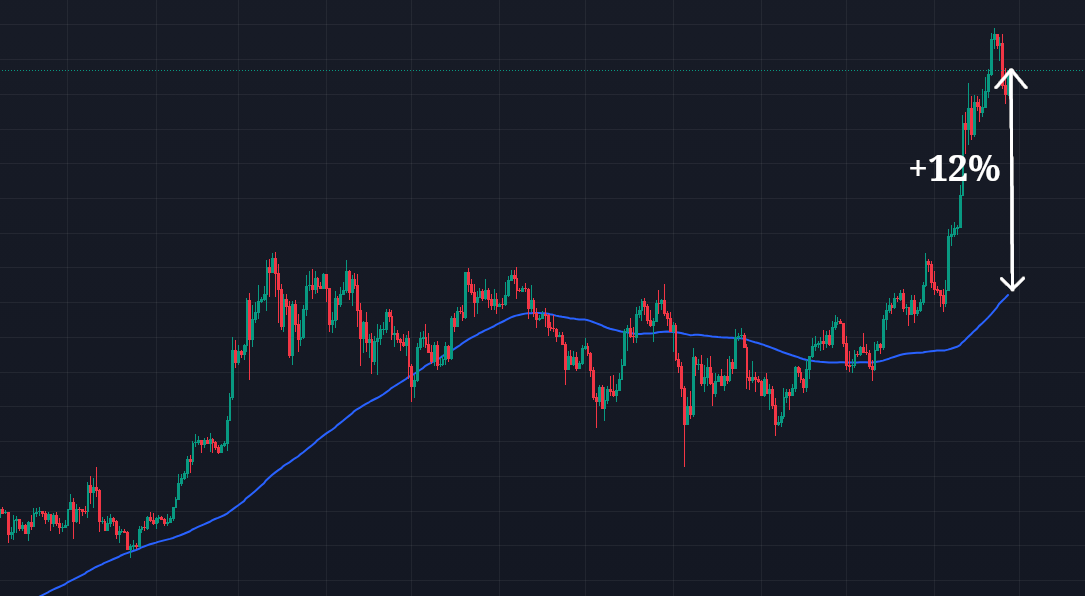
The Simple Moving Average (SMA) is a popular technical indicator used to analyze the price movements of assets over time. It is calculated by averaging the closing prices over a specific number of periods, such as 10, 50, or 200 periods. Traders use SMA to identify the overall trend direction, support and resistance levels, and to spot potential reversal points in the market.
How is SMA Calculated?
The SMA is calculated by taking the average of the closing prices over a defined number of periods. Here's the basic formula:
SMA = (P1 + P2 + ... + Pn) / nWhere:
- P1, P2, ..., Pn are the closing prices for each period
- n is the number of periods
In trading, different timeframes are used, such as 10, 50, or 200 periods. A shorter SMA (e.g., 10-period) responds quickly to price changes, while a longer SMA (e.g., 200-period) provides a smoother, more reliable trend indicator.
How to Use SMA Effectively
Here are some actionable strategies for using SMA in your trading:
- Identify Trends: A rising SMA indicates an uptrend, while a falling SMA suggests a downtrend. Use the SMA to confirm the market direction before entering trades.
- Spot Support and Resistance Levels: SMAs often act as dynamic support or resistance levels. When the price approaches the SMA, it can bounce off, signaling a potential reversal.
- Use Crossovers: The most popular strategy is the Moving Average Crossover, where a shorter-term SMA (e.g., 10-day) crosses above a longer-term SMA (e.g., 50-day). A crossover to the upside signals a buying opportunity, while a crossover to the downside suggests a selling opportunity.
- Combine with Other Indicators: Use SMA alongside other indicators, such as the RSI, for confirmation. For example, if the price is near a support level indicated by the SMA, and the RSI shows the market is oversold, this could be a strong buy signal.
Simple Ways for Beginners to Use SMA
If you're new to trading, here are some beginner-friendly strategies to help you get started with the SMA:
- Stick to one timeframe, such as daily charts, for less noise and a clearer view of the trend.
- Look for crossovers: Buy when the short-term SMA crosses above the long-term SMA, and sell when it crosses below.
- Use SMAs for confirmation: Always combine SMA signals with price action and other indicators to ensure higher accuracy.
- Don’t rely solely on SMAs: While SMAs are great trend-following tools, remember to consider the broader market context and price trends before making any decisions.
Key Takeaways
The Simple Moving Average (SMA) is a versatile momentum indicator that can help you identify trends, support and resistance levels, and reversal points in the market. Here’s a quick summary:
- SMA is calculated by averaging the closing prices over a specific number of periods (e.g., 10, 50, or 200 days).
- It helps to identify trends, with rising SMAs indicating uptrends and falling SMAs indicating downtrends.
- Use the SMA crossover strategy to spot buying and selling signals, especially in conjunction with other indicators like the RSI.
- For beginners, stick to one timeframe, focus on crossovers, and always confirm your SMA signals with other indicators.
Mastering the SMA, particularly when used alongside other technical indicators, can greatly improve your trading accuracy. Whether you're trading manually or automating your strategy through algorithmic trading, SMA can help you make more informed decisions.
Roman - creator of TradingMaps.co
What's your thoughts?
If you have any suggestion or question, please email me at support@tradingmaps.co, or leave a comment below: