Mastering EMA: The Exponential Moving Average for Smarter Trading
Unlock the power of EMA in your trading strategy. Whether you're a beginner or an experienced trader, this guide explains how the Exponential Moving Average can be used to refine your trading approach and even automate your strategies in algorithmic trading.
The Exponential Moving Average (EMA) is one of the most powerful tools in technical analysis, especially for traders looking to identify trends, support and resistance levels, and potential reversal points in the market. Unlike the Simple Moving Average (SMA), the EMA gives more weight to recent price action, making it a more responsive indicator. This guide will explore the basics of the EMA, how it's calculated, and effective strategies for using it in your trading decisions.
What is EMA?
The Exponential Moving Average (EMA) is a popular technical indicator used to analyze the price movements of assets over time. Unlike the Simple Moving Average (SMA), which gives equal weight to all past prices, the EMA places more emphasis on the most recent prices. This makes it more sensitive to recent price changes, allowing traders to identify trends more quickly.
The EMA is widely used in various financial markets, including stocks, forex, and cryptocurrency. It helps traders determine the direction of the market, identify potential entry and exit points, and fine-tune their strategies.
How is EMA Calculated?
The EMA is calculated by applying a smoothing factor to the most recent closing prices. The formula for EMA is:
EMA = (Current Price * (K)) + (Previous EMA * (1 - K))Where:
- Current Price is the most recent closing price of the asset.
- Previous EMA is the EMA from the previous period.
- K is the smoothing constant, calculated as:
K = 2 / (N + 1), where N is the number of periods (e.g., 10, 50, or 200).
Shorter EMAs (e.g., 10-period) react faster to price changes, making them useful for short-term trading. Longer EMAs (e.g., 50 or 200-period) are smoother and provide more reliable trend signals over longer timeframes.
How to Use EMA Effectively
Here are some premium strategies for using EMA in your trading:
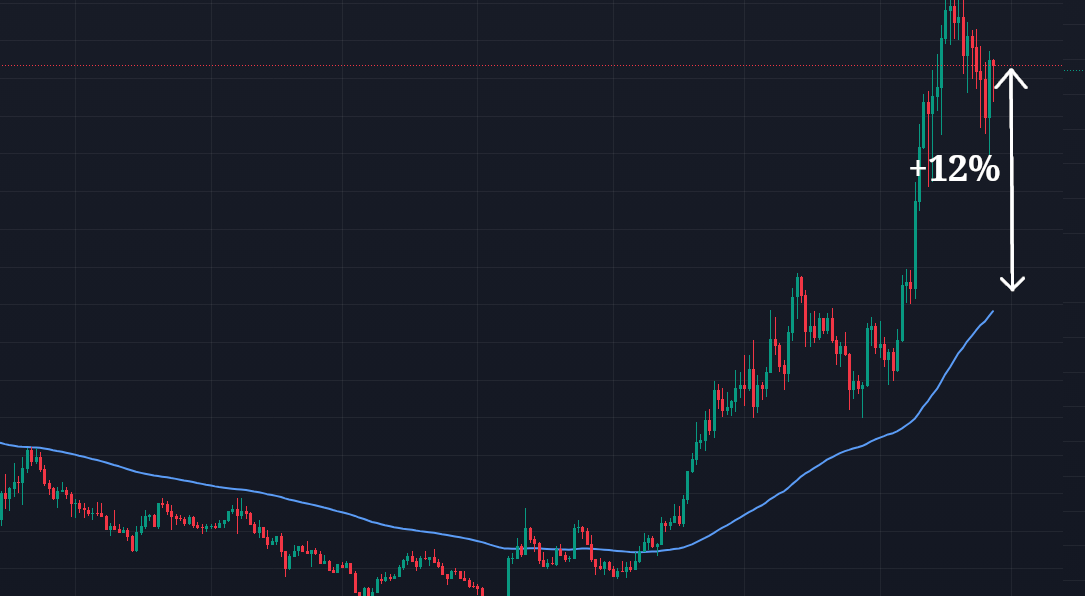
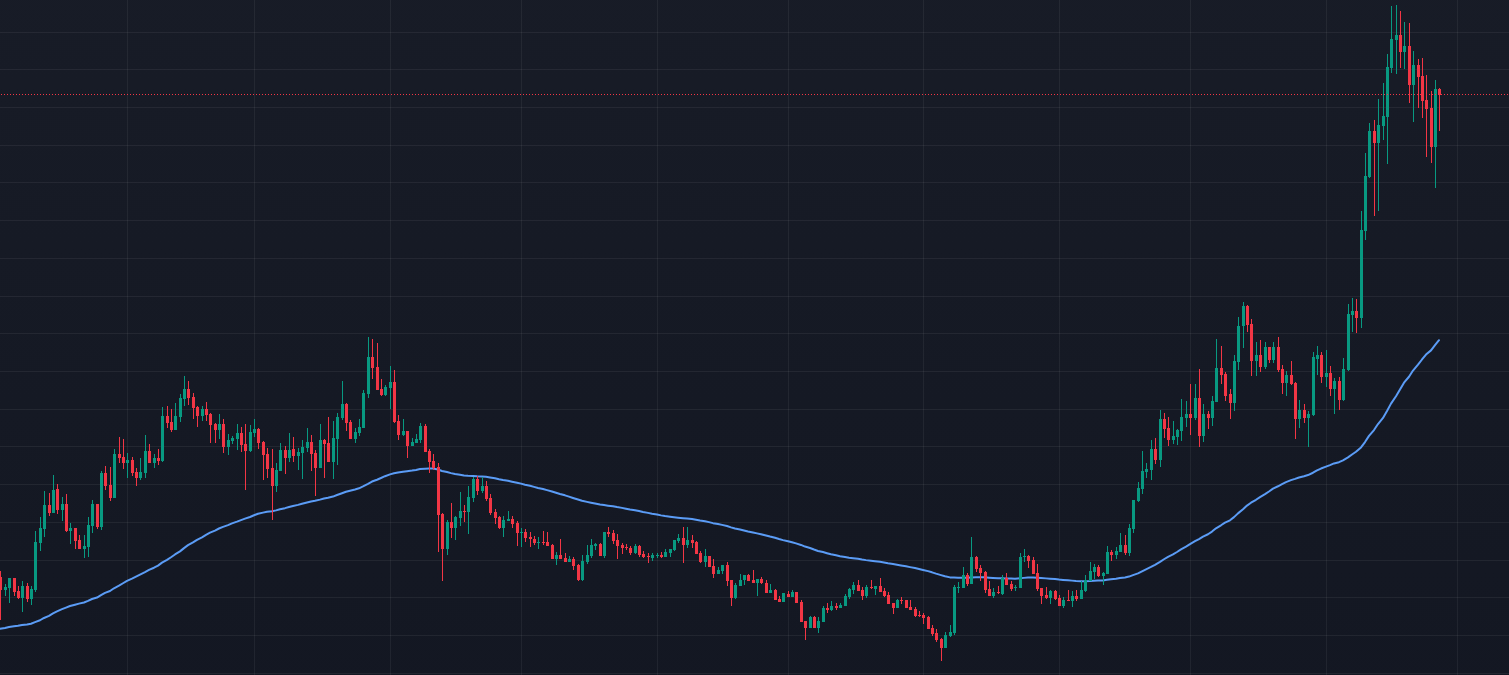
- Identify Market Trends: EMAs are excellent for determining the direction of the market. When the price is above the EMA, it indicates an uptrend, while a price below the EMA suggests a downtrend. By identifying these trends, traders can enter trades that align with the market's direction.
- Spot Support and Resistance Levels: EMAs often act as dynamic support and resistance levels. When the price approaches the EMA from above, it may bounce off the line, indicating support. Conversely, when the price approaches from below, the EMA may act as resistance, signaling a potential reversal.
- Use Crossovers for Entry/Exit Signals: One of the most popular strategies is the Moving Average Crossover. A crossover occurs when a shorter-term EMA crosses above or below a longer-term EMA. For example, a 10-day EMA crossing above a 50-day EMA is often seen as a buy signal, while a crossover below indicates a selling opportunity.
- Combine EMA with Other Indicators: EMA works best when used in conjunction with other technical indicators, such as the Relative Strength Index (RSI) or the Moving Average Convergence Divergence (MACD). These indicators can confirm the signals provided by the EMA, improving the accuracy of your trades.
Algorithmic Trading with EMA
In algorithmic trading, the EMA can be used to automate entry and exit points based on predefined rules. Traders can program algorithms to place buy or sell orders when the price crosses the EMA or when certain crossover conditions are met. I personally use the EMA(200) with no second short-term EMA, just crossover with price itself, as an effective trend-following strategy. And sometimes, by combining EMA with other indicators like an ATR for example, algorithms can be designed to spot trends, reversals, and optimal trade opportunities with minimal human intervention.
Algorithmic strategies often rely on backtesting to refine the parameters of the EMA (while trying to avoid overfitting) and to optimize the strategy's performance. By using real-time data, algorithms can execute trades at lightning speed, capitalizing on price movements before human traders can react.
EMA Trading Tips for Beginners
If you're new to trading, here are some beginner-friendly tips to help you use the EMA effectively:
- Start with the Basics: Begin by using a simple 50-period or 200-period EMA to identify the overall trend. Once you're comfortable with the indicator, you can experiment with shorter EMAs for more advanced strategies.
- Use Multiple Timeframes: Analyze different timeframes to get a clearer view of the market. For example, use a long-term EMA (e.g., 200-period) to determine the overall trend and a short-term EMA (e.g., 10-period) to find entry points.
- Combine EMA with Price Action: While EMAs are great for identifying trends, they work best when combined with price action. Look for candlestick patterns or chart formations near the EMA to confirm your trade decisions.
- Don’t Rely on EMA Alone: EMA is a great tool, but no single indicator is foolproof. Always use it in conjunction with other technical indicators, market analysis, and risk management strategies.
Key Takeaways
The Exponential Moving Average (EMA) is an essential tool for traders looking to stay ahead of market trends and make more informed trading decisions. Here's a quick recap of the key points:
- EMA is more responsive to recent price movements than the Simple Moving Average (SMA), making it ideal for spotting trends quickly.
- Use EMAs to identify the direction of the market and spot dynamic support and resistance levels.
- The Moving Average Crossover strategy, and especially the Exponential Moving Average Crossover, is a powerful way to spot buy and sell signals.
- EMA can be automated in algorithmic trading strategies to execute trades based on predefined conditions.
- For beginners, start with longer periods (50 or 200) and gradually experiment with shorter EMAs as you gain confidence.
By mastering the EMA and using it alongside other technical indicators, you can enhance your trading strategies and improve your overall market analysis. Whether you're a manual trader or an algorithmic trader, the EMA is an indispensable tool in your trading arsenal.
Roman - creator of TradingMaps.co
What's your thoughts?
If you have any suggestion or question, please email me at support@tradingmaps.co, or leave a comment below: