Understanding RSI: The Relative Strength Index for Smarter Trading
Here's a simple guide to mastering RSI in trading – what it is, how it works, and how you can use it to enhance your trading strategy.
Did you know that most traders struggle to utilize RSI effectively? The Relative Strength Index (RSI) is one of the most powerful tools in technical analysis, yet it's often misunderstood. In this guide, we’ll simplify RSI for you, covering its basics, calculations, strategies, and a practical beginner-friendly approach.
What is RSI?
RSI, short for Relative Strength Index, is a popular momentum oscillator used in trading to measure the speed and magnitude of price movements. It ranges between 0 and 100 and helps traders identify potential overbought or oversold conditions in the market. This can signal when to enter or exit trades.
How is RSI Calculated?
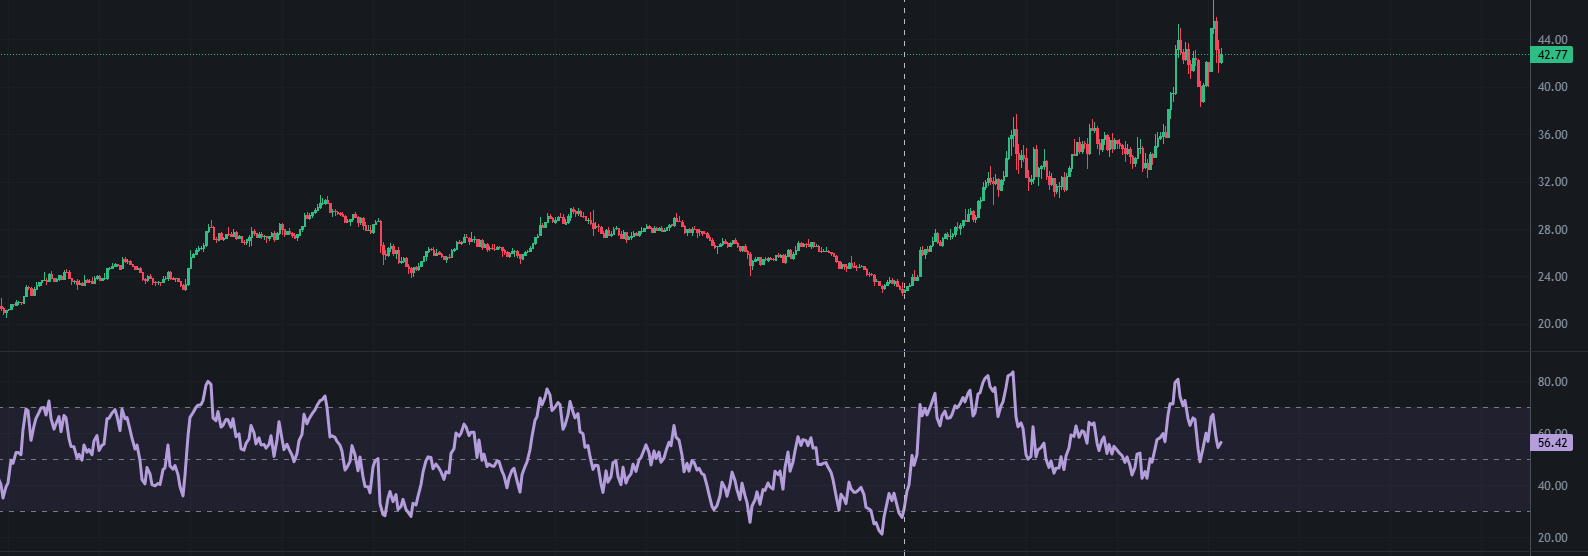
RSI is calculated using a formula that compares average gains and losses over a specific period, usually 14 periods by default. The formula is:
RSI = 100 - [100 / (1 + RS)], where RS = Average Gain / Average LossThe resulting value oscillates between 0 and 100. This is useful: it lets compare the metric for a set of tokens or financial assets as you can see in the heatmap. Levels above 70 indicate an "overbought" condition, while levels below 30 suggest "oversold" conditions. Note tha being overbought does not mean the coin cannot go higher in any way. It can. Same for oversold, price may drop more sometimes. However, the real magic lies in how you interpret and apply RSI in various trading scenarios.
How to Use RSI Effectively
Here are some actionable strategies for using RSI in your trading:
- Identify Overbought and Oversold Levels: Use the default levels of 70 and 30 to spot extreme conditions in the market. Again, use this as a confluence with other signals. "Overbought"/"oversold" alone does not mean nothing.
- Spot Trend Ranges: In a bullish trend, RSI often stays above 40, while in bearish trends, it stays below 60. Adjust your strategy accordingly.
- Find Divergences: Watch for situations where price and RSI move in opposite directions. Bullish divergence signals a reversal to the upside, while bearish divergence suggests the opposite.
- Combine with Other Indicators: Use RSI alongside moving averages or trendlines for confirmation before making a trade.
Simple Ways for Beginners to Use RSI
If you're new to trading, start with these simple RSI strategies:
- Stick to one timeframe, such as daily charts, for less noise.
- Look for overbought (>70) or oversold (<30) signals, but wait for confirmation from price movements.
- Keep it simple: Buy when RSI crosses above 30, and sell when RSI crosses below 70.
- Avoid trading solely based on RSI. Always consider price trends and market context.
Key Takeaways
The Relative Strength Index (RSI) is a versatile momentum indicator that can be used to spot trends, reversals, and key levels in the market. Here's a quick summary:
- RSI ranges from 0-100; levels above 70 are overbought, below 30 are oversold.
- It works on all timeframes and is more reliable on higher ones.
- Use RSI ranges and divergences to gain deeper insights into market momentum.
- Always combine RSI with price action for better accuracy.
Master RSI, especially on higher timeframes like daily and weekly for example and you’ll unlock one of the most powerful tools in technical analysis.
Roman - creator of TradingMaps.co
What's your thoughts?
If you have any suggestion or question, please email me at support@tradingmaps.co, or leave a comment below: