Here are the values shown in the heatmap, the BB width relative to its middle line value expressed in percentage
Explore Bollinger Bands Width for Popular Assets
Mastering Bollinger Bands: Your Key to Smarter Trading
Unlock the power of Bollinger Bands in your trading strategy. Whether you're a beginner or an experienced trader, this guide will explain how Bollinger Bands can refine your approach and even help automate your trading strategies in algorithmic trading.
The Bollinger Bands is one of the most effective and widely used technical indicators in trading. Whether you’re trading manually or through algorithms, Bollinger Bands help traders identify market trends, support and resistance levels, and potential reversal points. In this guide, we'll walk you through the basics of Bollinger Bands, how to use them, and how they can be incorporated into algorithmic trading strategies.
What are Bollinger Bands?
The Bollinger Bands consist of three lines plotted on a price chart. These lines are:
Middle Band: This is the Simple Moving Average (SMA), typically set to a 20-period moving average.
Upper Band: The upper band is calculated by adding two standard deviations to the middle band.
Lower Band: The lower band is calculated by subtracting two standard deviations from the middle band.
Traders use the Bollinger Bands to assess market volatility. When the price is near the upper band, the market is considered overbought, and when the price is near the lower band, it is considered oversold. These bands expand and contract based on market volatility, making them useful for spotting breakout opportunities.
How are Bollinger Bands Calculated?
The calculation of Bollinger Bands starts with the Simple Moving Average (SMA). Here's the basic formula:
Middle Band = 20-period SMA of the closing prices
The Upper and Lower Bands are calculated by adding and subtracting two times the standard deviation from the Middle Band:
Upper Band = Middle Band + (2 * Standard Deviation)
Lower Band = Middle Band - (2 * Standard Deviation)
A standard period for the bands is typically 20 periods, but this can be adjusted based on your trading strategy or timeframe.
How to Use Bollinger Bands Effectively
Here are some actionable strategies for using Bollinger Bands in your trading:
Identify Overbought and Oversold Conditions: When the price moves near the upper band, it may indicate that the market is overbought, and a reversal or pullback could occur. Conversely, when the price touches the lower band, it may indicate an oversold condition and a potential buying opportunity.
Volatility Breakouts: A period of contraction in the Bollinger Bands often signals a potential breakout. If the price breaks above the upper band, it could indicate a strong upward move. Conversely, a break below the lower band could signal a downward trend.
Use the Middle Band as Support or Resistance: The middle band (the SMA) often acts as dynamic support or resistance. If the price bounces off the middle band, it could confirm the direction of the trend.
Combine with Other Indicators: Bollinger Bands can be used in combination with other indicators like the RSI (Relative Strength Index) to confirm signals. For example, if the price touches the lower band, and the RSI indicates oversold conditions, it could be a strong buy signal.
Simple Ways for Beginners to Use Bollinger Bands
If you're new to trading, here are some beginner-friendly strategies to help you get started with Bollinger Bands:
Stick to One Timeframe: Focus on a single timeframe (e.g., daily or hourly) to reduce market noise and focus on the bigger trends.
Watch for Breakouts: Look for times when the bands are contracting, which often precedes a breakout. The direction of the breakout can be confirmed by the price crossing the upper or lower band.
Use the Middle Band: Consider using the middle band as a dynamic support or resistance level. When the price bounces off the middle band, it could confirm the trend direction.
Don’t Rely Solely on Bollinger Bands: While they are a great tool, always confirm signals with other technical indicators to reduce the risk of false signals.
Key Takeaways
Bollinger Bands are a powerful tool that can help traders identify market volatility, potential reversals, and breakout opportunities. Here's a quick summary of the key points:
Bollinger Bands consist of three lines: the middle band (SMA), upper band, and lower band, which are based on the standard deviation of price.
Use Bollinger Bands to spot overbought and oversold conditions, as well as to identify potential breakouts or trend reversals.
Combine Bollinger Bands with other technical indicators, such as the RSI, for added confirmation when trading.
For beginners, focus on one timeframe, watch for contractions, and use the middle band as support or resistance.
Mastering Bollinger Bands can greatly improve your trading accuracy. Whether you are trading manually or automating your strategy through algorithmic trading, Bollinger Bands can help you make more informed, data-driven decisions.
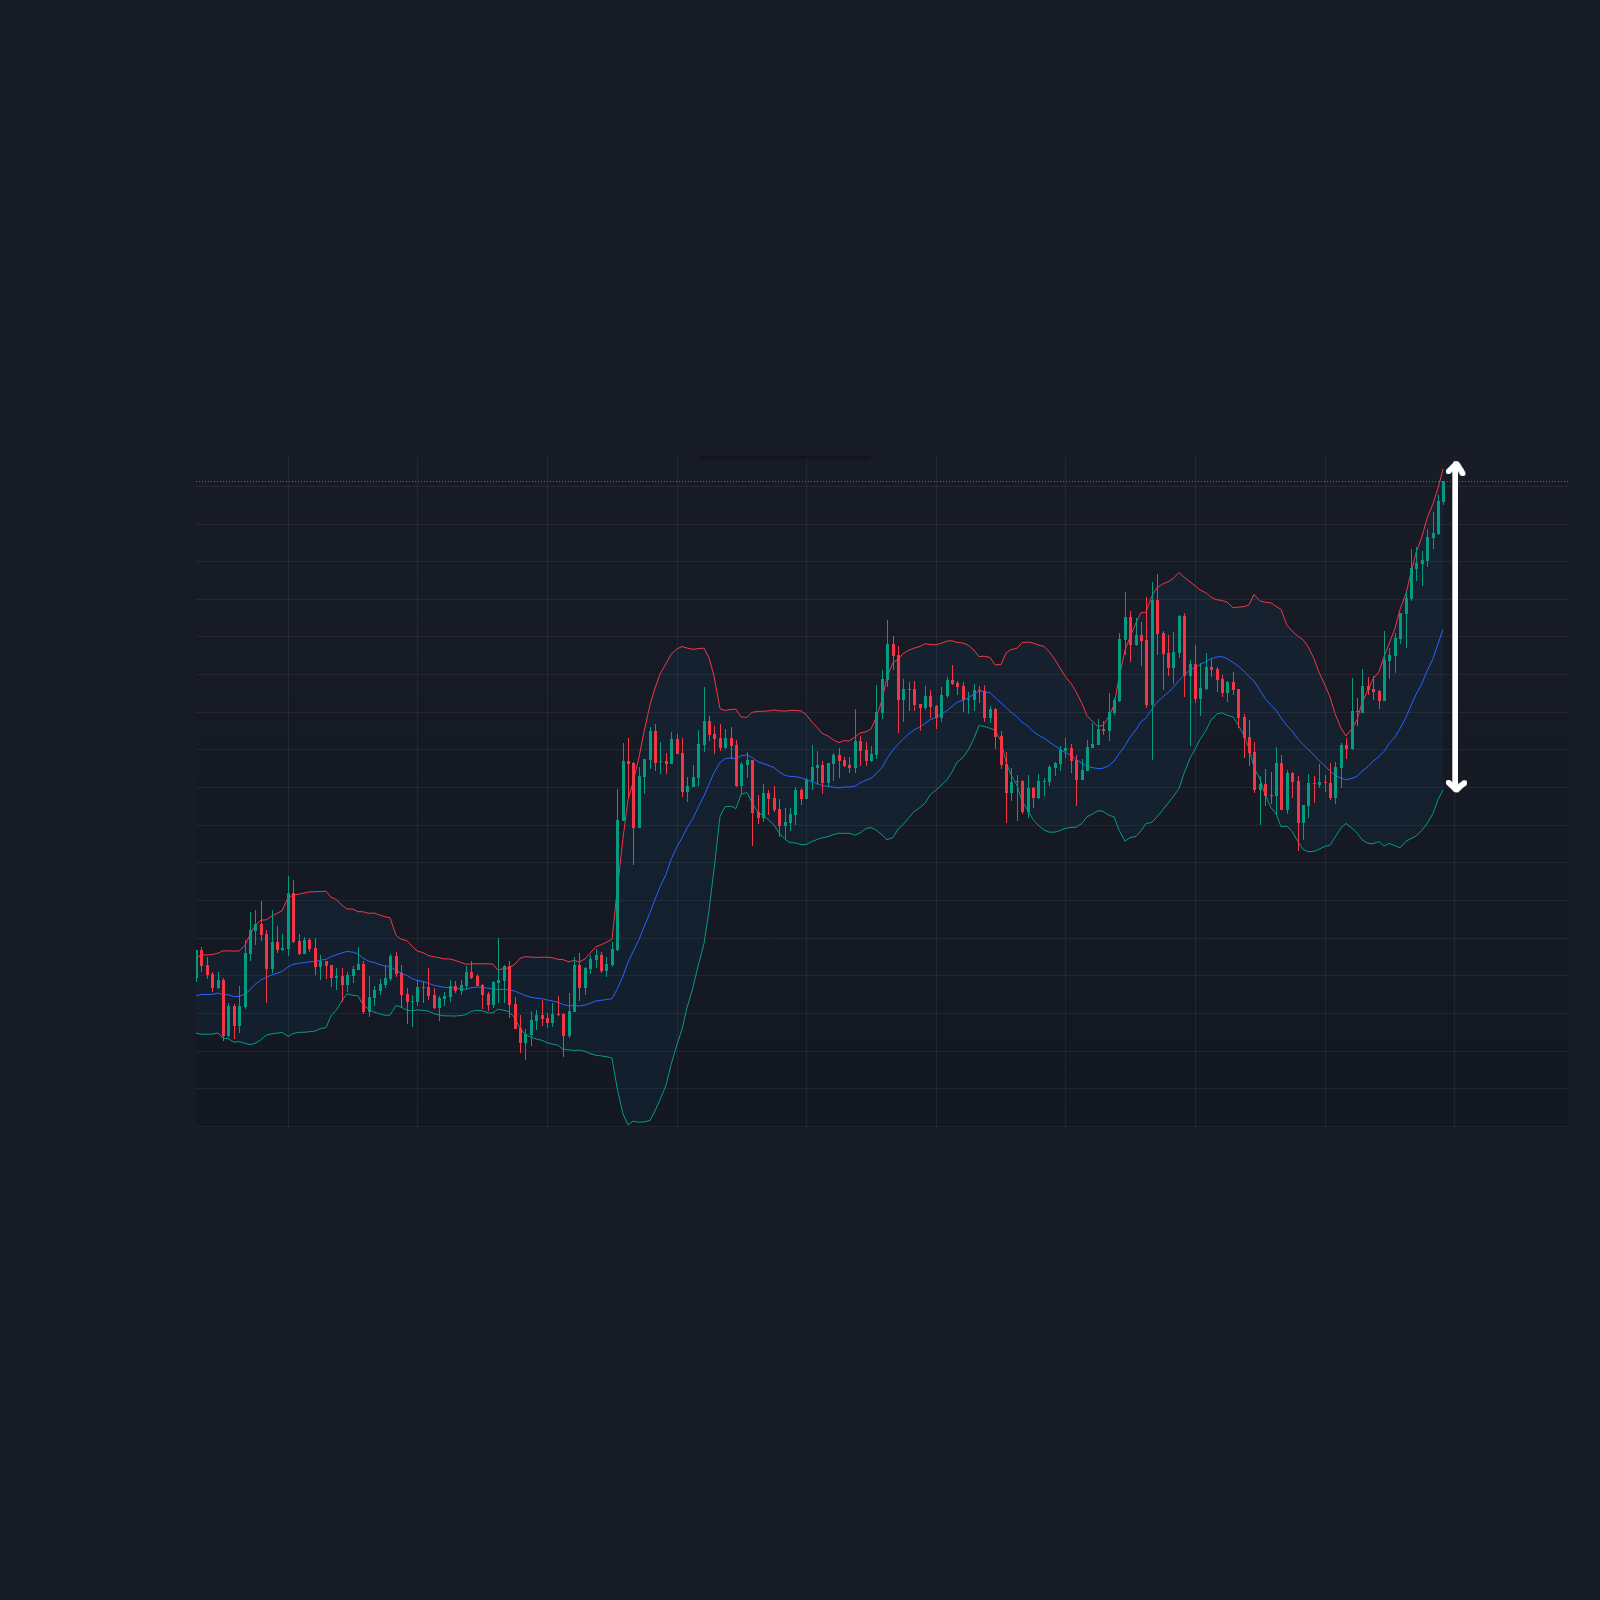
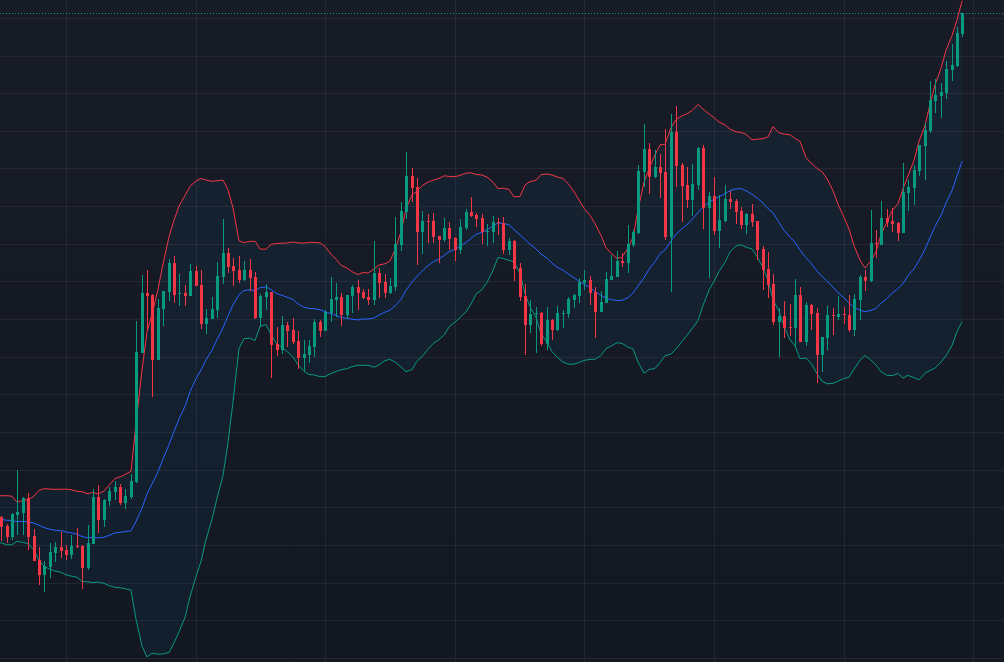
A visual representation of 20-period Bollinger Bands with a standard deviation of 2. Look how it widens when a big move happens...
Mastering Bollinger Bands for Smarter Trading
Understand the true power of Bollinger Bands and how they can help you make better trading decisions, especially when applied to the current unknown timeframe timeframe.
Bollinger Bands is a popular and versatile technical indicator used to measure market volatility and price levels over a defined period. Unlike traditional moving averages, Bollinger Bands consist of three lines: the middle line, which is a Simple Moving Average (SMA) of the asset’s price, and two outer bands that represent standard deviations above and below the SMA. This tool is primarily used to identify volatility in the market and potential overbought or oversold conditions. By combining these bands with other indicators, traders can make informed decisions when trading or any other asset.
What Are Bollinger Bands?
The Bollinger Bands indicator consists of three key components:
Middle Band: This is the Simple Moving Average (SMA) of the asset's price over a specific period (e.g., 20 days). It serves as the baseline for the upper and lower bands.
Upper Band: This is the middle band plus two standard deviations. It represents the price level at which the asset may be overbought.
Lower Band: This is the middle band minus two standard deviations. It represents the price level at which the asset may be oversold.
The bands expand and contract based on price volatility. When volatility is low, the bands narrow, and when volatility is high, the bands widen. Bollinger Bands are commonly used to identify periods of high or low volatility, potential trend reversals, and overbought/oversold conditions.
How to Use Bollinger Bands in Your Trading Strategy
Here are some of the most common strategies for using Bollinger Bands to trade :
Volatility Breakouts: When the price moves outside the Bollinger Bands, it suggests that volatility has increased and could signal a potential breakout. For example, if the price of moves above the upper band, this could indicate a strong uptrend or breakout. Conversely, if the price moves below the lower band, it may signal a strong downtrend or a breakdown.
Reversals at the Bands: Bollinger Bands can also be used to spot potential reversals. If the price approaches the upper band and starts to turn down, it may indicate that the asset is overbought and a reversal could be imminent. Similarly, when the price nears the lower band and starts to move up, it could suggest that the asset is oversold and a reversal is likely. These reversal signals can be especially helpful when trading on the unknown timeframe timeframe, providing clear entry and exit points.
Bollinger Band Squeeze: A "squeeze" occurs when the price becomes more stable, and the bands narrow. This suggests low volatility and a potential for the price to break out in either direction. A squeeze followed by a breakout can be a powerful trading signal for , indicating that a significant move is likely to happen soon.
Advanced Tips for Using Bollinger Bands
Combine Bollinger Bands with other indicators like the Relative Strength Index (Relative Strength Index (RSI)) or Moving Average Convergence Divergence (MACD) to confirm your trade signals. For example, if the price touches the lower band and the RSI shows oversold conditions, it may indicate a strong buy signal.
Watch for the "Bollinger Band Walk," where the price trends along the upper or lower band for an extended period. This can suggest strong momentum, whether bullish or bearish, in the direction of the trend.
Remember that price can move outside the Bollinger Bands, but it doesn’t always mean the trend is reversing. Use other confirmation signals to avoid false breakouts and ensure better trade accuracy.
Summary and Final Thoughts
Bollinger Bands are an essential tool in any trader’s technical analysis toolkit, especially for those trading or other assets. By measuring volatility and identifying overbought or oversold conditions, Bollinger Bands provide crucial insights into market behavior. Whether you're using the bands to spot breakouts, reversals, or volatility squeezes, this indicator can significantly enhance your trading strategy when used in conjunction with other tools.
Make sure to apply Bollinger Bands appropriately to adapt to the current market conditions. With a solid understanding of how to read the bands, you can make more informed trading decisions and improve your overall strategy.
Comments
Roman - creator of TradingMaps.co
What's your thoughts? If you have any suggestion or question, please email me at support@tradingmaps.co, or leave a comment below:
Roman - creator of TradingMaps.co
What's your thoughts?
If you have any suggestion or question, please email me at support@tradingmaps.co, or leave a comment below: